Next up: the Activity Diagram (we've already looked at Use Case and Class Diagrams).
Once again about notation:
Once again about notation:
- Blue text — tips or rules not dictated by UML, but borrowed from other useful theories or practical experience.
- Italics — examples.
An Activity Diagram is a process diagram (a type of behavioral diagram in UML). There are several of these in the world: flowcharts, Business Process Diagrams in BPMN — you'll find a close analogue in almost any notation. These diagrams illustrate steps in a process, their sequence, branching/loops and their conditions, and sometimes even who is responsible for what.
When to use it:
Use an Activity Diagram when you need to visually depict the kinds of things described above: a use case scenario that's too complex to read as text, a button behavior with tons of steps and branches, complex logic behind system calculations or decision-making, the flow of a business process, etc. Visuals make it easier for you to assess correctness and for others to understand.
Elements:
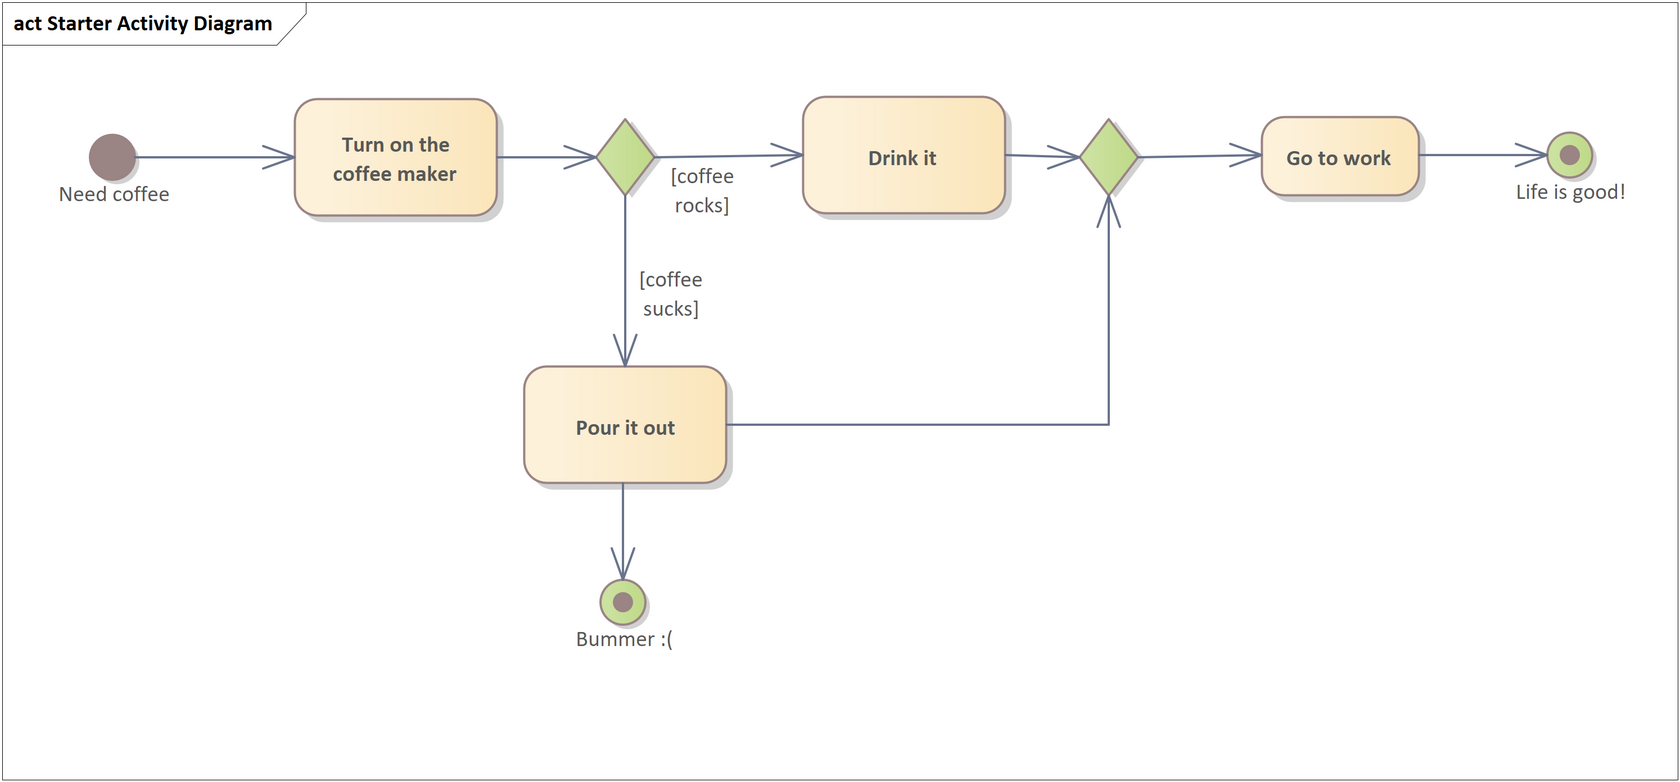
Action: The core element of the diagram — an atomic step within the process being modeled. For example, a step in a use case scenario. It's shown as a rectangle with rounded corners.
Decision and Merge: Show how a process can branch depending on some condition or merge back into a single flow. Both are shown as diamonds. For example, during a use case, the system checks if input data is valid and either proceeds or displays an error.

Nuances:
- A decision is a fork into alternative flows (either-or); only one of the outgoing flows will be followed. To visualize this properly, imagine a dot (or dots) traveling through the diagram over time.
- When flows merge, a merge waits for one incoming flow (not all). As soon as one arrives, the process continues. See the note about merge in the earlier example.
There are two ways to indicate what the decision is based on:
- Place the condition/question near the decision diamond, and write answers (called guards) in square brackets on the outgoing arrows. Analysts often skip the brackets — not strictly UML-correct, but understandable.
- (More UML-purist) Write full guard conditions on the outgoing arrows, without labeling the decision node itself.

Initial Node and Activity Final Node: The start and end points of the process. The initial node is a filled-in circle; the final node is the same, but inside a hollow circle. Analysts often label these with the system or actor state at the start/end of the process — great for use case preconditions/postconditions.
Nuances:
There can be multiple initial nodes, meaning the process starts from all of them — rare, but a great interview flex. There can also be multiple end nodes; the process ends when it reaches any of them.
Partition: A visual division of the diagram that groups elements by participant. For a use case, typical partitions are "Actor" and "System". These can be displayed horizontally or vertically.

Fork/Join: Similar to Decision/Merge but for parallel flows. Displayed as thick horizontal or vertical bars.
Nuances:
Unlike Decision, a Fork splits the incoming flow into multiple concurrent flows. A Join waits for all incoming flows (not just one) before the process continues.
Nuances:
Unlike Decision, a Fork splits the incoming flow into multiple concurrent flows. A Join waits for all incoming flows (not just one) before the process continues.

Connections:
The primary connection is Control Flow — arrows with open heads that connect elements. These can include guards in square brackets, which define the conditions under which the flow follows that path. Especially relevant for decisions.
The primary connection is Control Flow — arrows with open heads that connect elements. These can include guards in square brackets, which define the conditions under which the flow follows that path. Especially relevant for decisions.
Advanced aspects:
You can show data passing on the diagram in two ways (and honestly, I still don’t know the meaningful difference between them — if you do, please send me a comment):
Object: A rectangle representing a data object passed between elements.
You can show data passing on the diagram in two ways (and honestly, I still don’t know the meaningful difference between them — if you do, please send me a comment):
Object: A rectangle representing a data object passed between elements.

Even though the arrow looks the same, it’s formally an Object Flow, not a Control Flow. Mentioning that at interviews is sure to impress.
A second approach: Pins. Small squares attached to actions, also used to indicate data input/output.
A second approach: Pins. Small squares attached to actions, also used to indicate data input/output.

Activity: This is the process itself. Everywhere we've said "process," you could swap in "Activity." The diagram as a whole is about one Activity. Sometimes boundaries of the Activity are shown explicitly — a rounded rectangle around the whole diagram.

To embed one process into another, use a special type of action: Call Activity Action. If you see an action with a trident icon, that means it's a call to another Activity, usually detailed in a separate diagram.

Interruptible Edge: Useful but can clutter your diagram. This lets you show that something can go wrong in a region of steps (not just a single action). For instance, the user could cancel the whole process at several steps. It involves a dashed-line region, an event symbol, and a lightning-bolt-shaped Interrupt Flow.

Common Mistakes:
As before, here are all of them in a single diagram. Then we’ll break it down.

- Missing decision, merge, fork, or join elements where branching or merging happens.
Informal rule: actions should have just one input and one output. If more, you need branching/merging elements (diamonds/bars).
- No actions — replaced by flows.
Flows (Control, Object, Interrupting) just connect elements. They cannot be actions or data objects. Always explicitly show actions.
- Dangling subprocesses, missing branches, broken loops, and other logic errors.
If an action has no outgoing arrow, your process is stuck. Imagine those moving dots again: they must reach an end. A decision or fork with only one outgoing flow, or a merge/join with only one input? You're doing it wrong — these elements are meant to split or combine flows.
- Missing guards on decision outputs.
Without guards, how do we know which path to take? Just add them.
- Confusing actions and events.
An action is something done ("the system checks X"). An event is something that happens ("timeout occurs"). UML has a way to show events, and we covered one variant (interrupting event). They’re rarely needed and not everyone reads them well, so we mostly skip them here. Just don't mix the two.
